CCTV project update: more cameras, further analysis, and how you can access the data
Over the last two years, the Urban Big Data Centre (UBDC) has developed a unique partnership with Glasgow City Council (GCC) and the Glasgow Centre for Population Health (GCPH) to develop methods for measuring pedestrian and vehicle activity.
The project uses spare capacity in the city’s CCTV system to generate counts from regularly captured images. Initially developed to help the Council understand the impacts of major public realm, the project has expanded to monitor activity levels across a much broader range of settings. This blog reports on progress of the project and provides some examples of the types of analysis we have carried out over the last year. It also provides information on how to access the open data via an API and outlines ongoing research in this area.
As councils move to create more sustainable cities, reducing car use and increasing active travel and public transport use, there is an imperative to understand how transport patterns change. As new public realm infrastructure is introduced, we need to measure the impacts not just on the transport but on how people use the streets. There are many ways of monitoring vehicles and pedestrians, but these can be expensive and inflexible. Using the spare capacity in CCTV networks creates a relatively cheap but also extremely flexible way of monitoring traffic, limited only by the number of cameras in the network. These sorts of data offer social scientists valuable insight into how change impacts on a range of dimensions not just transport but on other factors like how people use streets, and the effectiveness of street design.
Progress to date
The original pilot study (Nov 2019–Dec 2019) involved the use of four cameras. These captured images from a fixed ‘home’ position every 15 minutes. Images were processed on a computer located within the CCTV centre’s secure environment meaning there was no need to transfer potentially sensitive images to the University. All that is released are the summary counts. We used open-source software tools so that the resulting code could be freely shared with other local authorities. The GCC team developed methods that ensured that our needs did not interrupt the normal duties of the community safety or traffic management teams.
With the onset of the pandemic in March 2020, GCC were keen to see the project rapidly scaled up to cover a wider range of areas to help them monitor compliance with the lockdown restrictions. We currently have 37 cameras and the focus has widened to include local high streets and major parks as well as a greater number of central locations. Thanks to agreement with GCC, these data are now openly available through an API on the UBDC website (details below). They are now regularly incorporated in the statistics provided by ONS in their reporting to Sage and the Westminster Government . The project has also provided analysis to the police to help inform their resource allocation. We are currently working to provide data to the Council to inform the decision making on the restructuring of one of the city’s most dangerous junctions.
How we have used the data
In the early stages of the pandemic, UBDC used data from the three cameras in the original pilot to produce regular updates on changing pedestrian and vehicle activity . Figure 1 shows the impact of the first lockdown on both pedestrian and vehicle activity in the city centre, for example.

Figure 1 Relative activity volume for cars and pedestrians
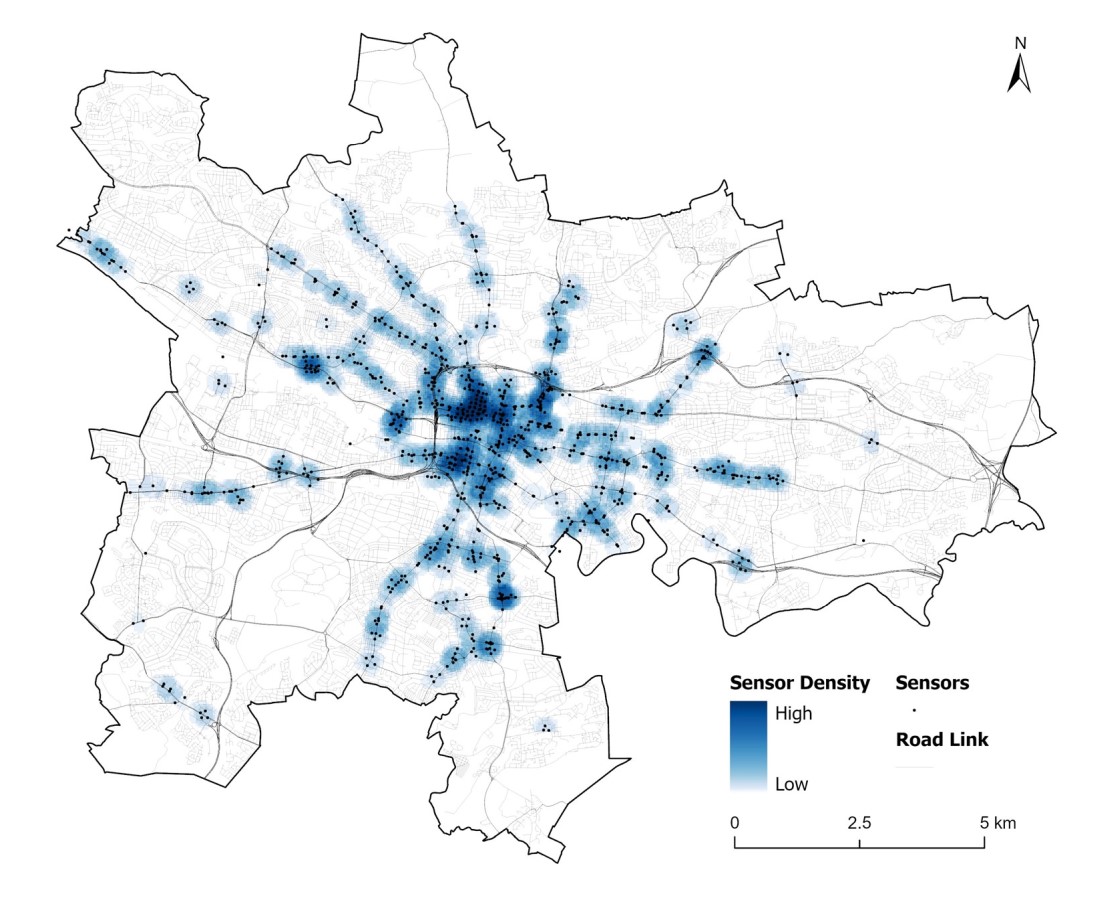
Figure 2 shows the pedestrian activity across 35 of the cameras during May and June of last year along with an image showing the ‘home’ position view they each cover. It gives a good idea of the breadth of coverage we have with the current cameras.

Figure 2 Pedestrian volumes across the city by average count (open full size image in a new window)
Our latest blog using the CCTV data has looked at pedestrian footfall following the most recent change in the rules on the 26th April of this year. Figure 3 compares pedestrian footfall in the week after lockdown eased to the average for the previous 16 weeks, averaging across the cameras in different kinds of location. It shows how the system can provide near-real-time feedback (within a day or a week) on how public behaviour is changing in different kinds of locations and at different times of day, right across the city.

Figure 3 Daily average footfall based on CCTV counts before and after lockdown
Most recent and future developments
Following an additional award from the ESRC for 2020/21, we have been working to expand the capabilities of the project to include video analytics, working with Newcastle University’s Urban Observatory. We have already developed models to track pedestrian movements through the cameras’ field of vision and hope to have these installed within the CCTV network in the coming weeks. You can watch a video of the software in action on YouTube (using open-source video footage from Oxford).
If you would like further information we have produced several blogs about the project.
Access to data
Glasgow City Council has agreed to release the count information from the CCTV camera network as open data, under the Open Government Licence. To facilitate access to the data, and to encourage its use in widespread analyses, apps and dashboards, UBDC colleagues have created a RESTful API that is now available from our API landing page.
Project Team
- UBDC (and the authors of this blog): Dr Mark Livingston (lead); Luis Serra; Dr David McArthur; Dr Andrew McHugh; Maralbek Zeinullin
- Glasgow City Council: Kimberley Hose; Keith Scott; Kalim Uddin
- Glasgow Centre for Population Health: Bruce Whyte