
Introducing the Waterproofing Data dashboard v.0.0.1

.svg)
.svg)

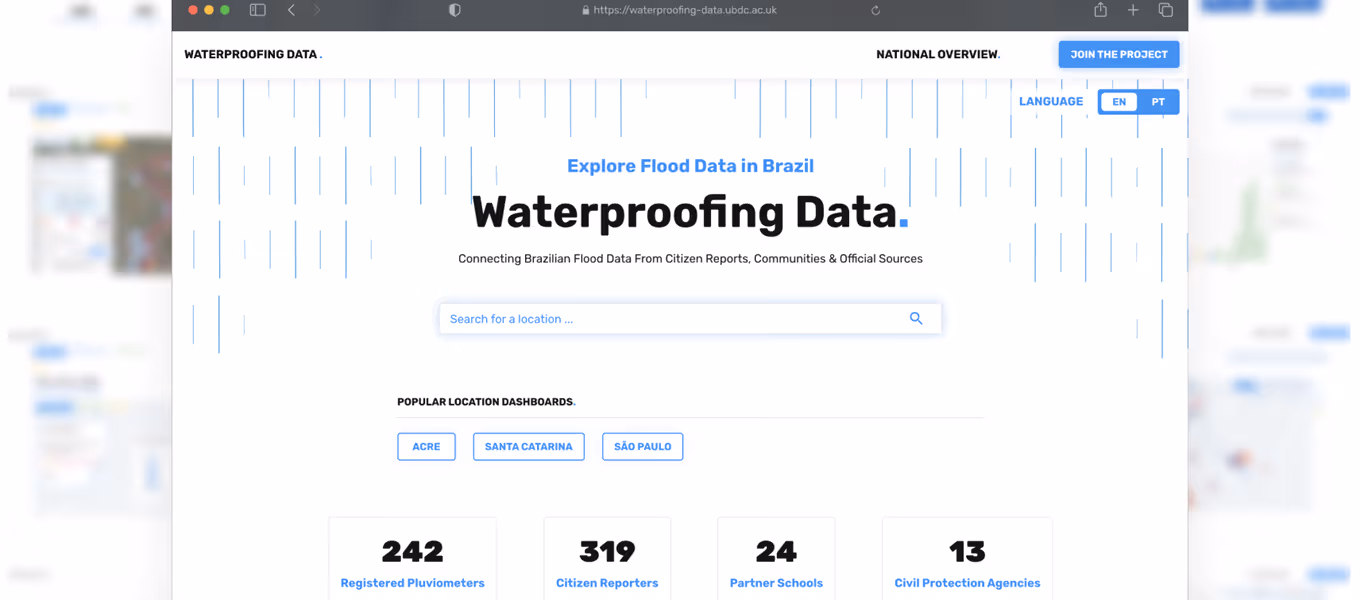
Using data visualisation and storytelling techniques, the Waterproofing Data dashboard connects flood data from communities, citizen reports and official sources around Brazil.
In this blog, Andy Clarke and Professor João Porto de Albuquerque introduce the latest instalment from the Waterproofing Data project - a public web platform presenting maps and charts visualising flood-related data in Brazil. Bringing together data from weather stations, disaster risk mapping and citizen science, the dashboard app was developed with the dialogical approach of the Waterproofing Data project.
Background
The Waterproofing Data project investigated how to build community resilience to flooding by engaging stakeholders in the process of generating the data used to predict when floods will occur. With an international, transdisciplinary team of researchers and practitioners from Brazil, Germany and the UK, the project co-produced data innovations that address major adaptation and data gaps around the world regarding the local impacts of climate hazards on vulnerable communities.
The Waterproofing Data dashboard is part of a larger ecosystem of data innovations that include a mobile app to collect data submissions from citizen reporters and a data lake to store, process and transform all sources of data found on the dashboard. These innovations have been co-produced with school teachers and disaster risk management professionals alongside a Guide for School Teachers to support using our data innovations in classrooms. They have been successfully trialled with 300+ school students and civil protection agents in Brazil and will be scaled up to engage citizens from vulnerable communities around the globe in transformative adaptation.

The Waterproofing Data project has already had significant impacts on flood-prone communities, resulting in it appearing on the shortlist for the Times Higher Education Awards 2022 Research Project of the Year: Arts, Humanities and Social Sciences.
Using the Waterproofing Data Dashboard
Designed to support flood resilience and prevention activities, the Waterproofing Data dashboard is intended for use by both community members and disaster risk management professionals, such as civil protection agencies. In adopting a place-based approach, the platform exists to serve flood-prone communities that also suffer from poor flood-related data coverage and engage them in activities that can help to make their communities more resilient to climate damage. Using the dashboard, partner communities and urban managers around Brazil can now monitor the data contributed by citizens through the Waterproofing Data mobile app and analyse these contributions within the context of data from official weather stations and flood hazard data from official agencies.
Community members and climate action professionals can use the dashboard to find recent and historical reports of flood-related activity in local areas. By presenting multiple narratives in the same place, the platform aims to enrich existing flood data coverage, increase critical consciousness and empower communities to participate in collective, preventative actions for reducing disaster risks.
Platform Features
🔍 Search Bar
Search for places across Brazil and access location-based dashboard pages.
🗺️ National Overview Map
An overview of citizen submissions and average rainfall across all of Brazil.
🌨️ Weather Reports
Weekly reports on weather conditions in specific places.
🧮 Location Overview Statistics
Monitor key statistics like maximum daily rainfall, number of citizen submissions and flood events.
⚖️ Add / Compare Locations
Choose up to 3 locations to compare using the platform’s charts and maps.
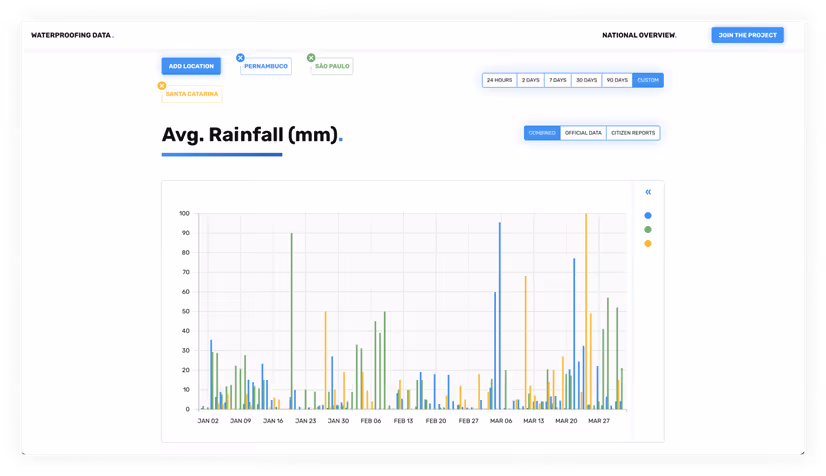
📊 Rainfall Chart
Bar chart showing average rainfall measurements across all pluviometers (rain gauges) in chosen regions and across a given date range. Based on citizen-generated data + official sources.
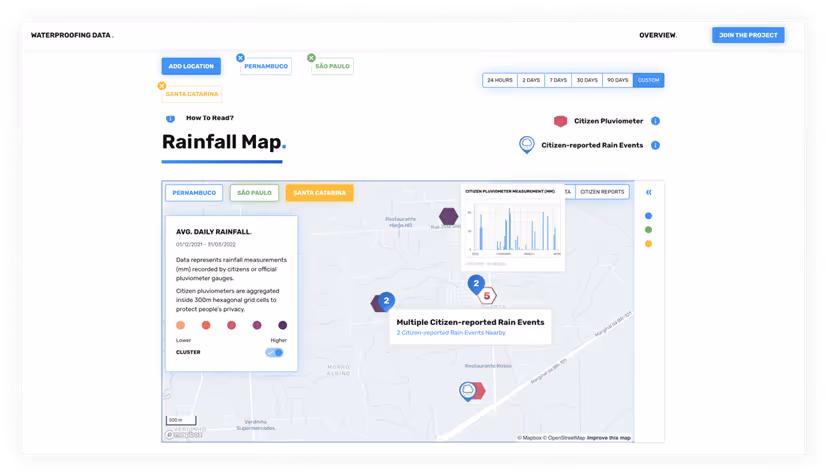
📍Rainfall Map
Map showing pluviometer measurements recorded by community members. The map also shows citizen-generated rainfall reports.
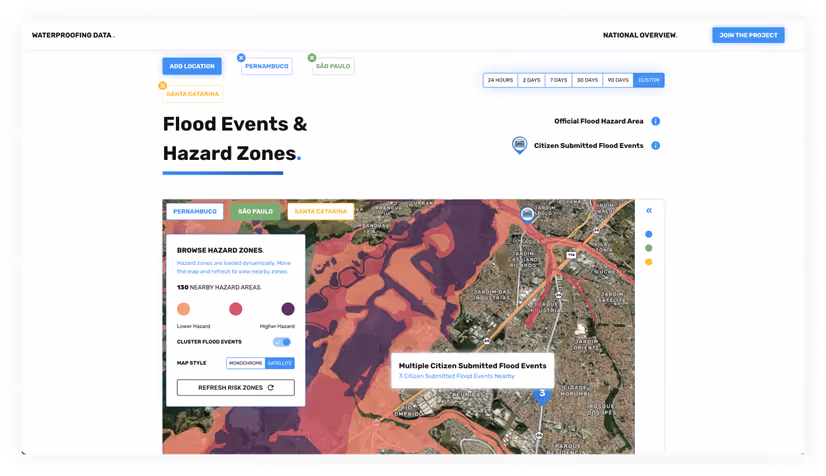
🌊 Flood Map
Map showing flood hazard zones across Brazil. The map also shows citizen-generated flood reports.
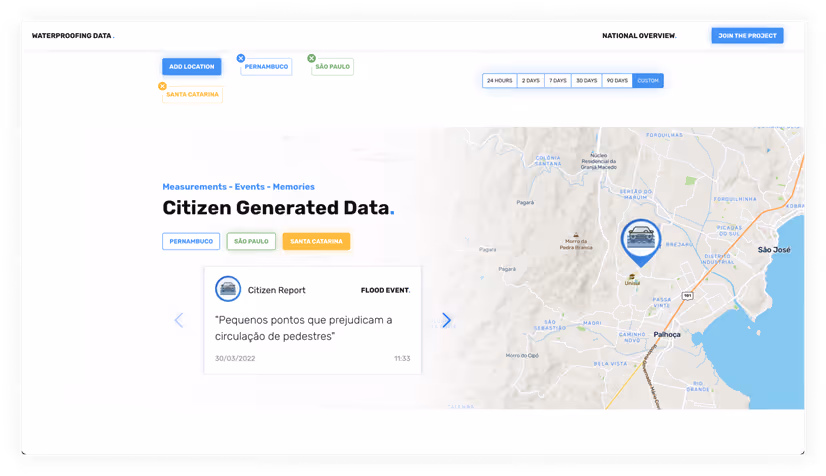
📣 Citizen Report Carousel + Map
Carousel showing all citizen-generated reports for a chosen region accompanied by a map revealing the location of each report.
Types of Maps & Data Visualisations
🗺️ National Overview Map
Found on the dashboard’s home page, the national overview map provides a visual representation of citizen reporting activity or average daily rainfall measurements across all of Brazil.
Representing regions as scalable hexagonal bins, the map aggregates the project’s underlying data to represent a geospatial distribution of data for either citizen submissions or rainfall measurements. Users can zoom in and out to view the data from different scales as well as adjust the size of the hexagonal bins using a slider to increase or decrease the geographical aggregation.

📊 Rainfall Chart
Found inside location-based dashboards, the rainfall bar chart represents a daily average of rainfall measurements recorded at all pluviometers within selected location boundaries. Users can compare up to 3 locations, scale the chart across different date ranges and hover over bars to reveal more data.
The chart’s sidebar provides a data overview, including the number of measurements and active pluviometers for each location during the chosen date range.
📍Rainfall Map
Found inside location-based dashboards, the rainfall map represents the locations of rainfall pluviometers and citizen-generated rainfall events. Pluviometers are coloured according to the scale (low - high) of the measurements they record. Hovering over a pluviometer will reveal a bar chart presenting its individual measurements. Hovering over a rain event reveals the original text submitted by the citizen.
To prevent a cluttered layout, pluviometers or citizen submissions near one another will automatically cluster and uncluster on zoom. In addition, a cluster switch is available to toggle this functionality on and off.
📣Citizen Report Carousel + Map
Found inside location-based dashboards, this feature combines all citizen reports for a selected location inside a scrollable carousel. Each report card contains the original citizen submission as well as supporting information including the date and time of the submission.
The accompanying map will jump to corresponding coordinates as a user scrolls through the carousel.
🌊 Flood Map
Found inside location-based dashboards, the flood map presents both flood hazard zones and citizen flood event reports. Hazard zones are categorised as either low, medium or high and reflect data taken from a study highlighting areas more subject to floods or landslides. These are loaded dynamically and currently users must refresh local risk zones as they browse new areas.
Hovering over a flood event icon will reveal the original text reported by a citizen.
The code and resources used to build the platform are publicly available in this Github repository.
A Dialogic Approach to Flood Data
One of the crucial tensions encountered throughout the Waterproofing Data project concerned the value of data generated by citizen reporters versus data coming from official sources (like weather stations). Instead of assuming any hierarchical relationship between them, the design and development of features inside the project’s dashboard app attempts to position different data sources as complementary narratives, highlighting the importance of citizens' knowledge based on their lived experiences of flooding.
Maps and charts found in the platform present citizen-generated data alongside data from official sources. A button group is provided alongside each of these data presentations so that users can turn off data from official sources or citizen science. Importantly, the default (combined) view integrates citizen-generated and official sources of data.
Further iterations of the platform will incorporate more official sources of data as well as further information on the citizen reports and measurements generated by the project.
Quick Case Study: Community Flood Response in Recife (May 2022)
In the last week of May 2022, a flood-related disaster caused 100 deaths as well as more than 7,000 people displaced and damage to housing and local infrastructure in the metropolitan area of Recife, in Pernambuco. The district of Jaboatão dos Guararapes, an area with a large population of active Waterproofing Data citizen reporters, suffered half of the deaths of all affected regions.
We had damages and houses affected in the areas of the project, but we had no victims because people left their homes at the early warnings. But in other areas of the district, where we did not have our community work, people resisted leaving their homes early and were severely affected, including human losses.POST-DISASTER CONVERSATION WITH CIVIL DEFENCE AGENT
Civil engagement in flood prevention activity is immensely important in communities across Brazil. The Waterproofing Data dashboard offers a tool for community members, urban managers and civil defence agents to participate in flood resilience-building.
Files
Latest news

Our co-created mapping guide featured as a guiding principle for responsible AI integration
A community-led mapping methodology co-developed by the University of Glasgow and partners has been recognised in a flagship international AI report, demonstrating how responsible AI can strengthen participatory approaches to multi-hazard early warning systems.

UBDC presents at the World Urban Forum 2026
The Urban Big Data Centre and Partners had a remarkable participation at the latest Would Urban Forum (WUF) in Baku, Azerbaijan. Within the topic “Housing the world: Safe and resilient cities and communities”.
New energy efficiency framework to address global net-zero carbon agenda
A new way of classifying energy efficiency that could benefit households and address the global net-zero carbon agenda has been developed by the Universities of Glasgow and Cambridge.
Jointly funded by
