
The UBDC Local Sustainability Data Blog


New sources of data can contribute to inclusive policymaking…
Lots of inspiring debates regarding the role of local-level data to accelerate progress towards achieving the 2030 Agenda have happened at the Global Goals Week, with a key milestone being the launch of the High Impact Initiative on the Power of Data. “Emerging”, “alternative” and “non-conventional” types of data, such as Big Data, and Digital Footprint Data (also termed “Smart Data’) are becoming key resources for urban policy-making. Urban operations already produce a vast amount of data in various forms.
Globally, at least around 500 cities have made their data openly accessible, with data ranging from health, such as health inequalities and food security to crime and disposable income and access to bank accounts. Rio de Janeiro has recently launched a ‘data lake, which includes data from a popular navigation App where users can feed back data on traffic and road conditions, which will be used to inform the municipal secretariat responsible for highway maintenance. In relation to Sustainable Development Goals target 11.2 (“Convenient access to public transport for all”), this kind of data initiatives significantly enhance the ability to “leave no one behind”.
In this case, live traffic data from an open navigation app can clearly improve the understanding of public transport needs across the city and enable global comparison of progress towards that SDG target. Similarly, an app developed as part of the Waterproofing Data project where citizens report rainfall levels and flooding to Brazil’s Centre for Disaster Risk Management in real time already provides valuable insights for policymakers to address flood risk. The data on flood risk perceptions can also be used to measure the cities’ progress towards SDG 13 (“Action to combat climate change and its impacts”).
…if we account for contested definitions and technical challenges
However, conversations with municipal government stakeholders indicate that the link between the exponentially increasing availability of data and the analytical value for policymaking is not always straightforward. The question of how to make sense of the data continues to present a major challenge. The data emerge from a variety of institutional and technical contexts, with differences in definitions. For example, how representative are the definitions of “convenient” access to public transport, or “high/medium/low” risk implicit in the data? What is “convenient”, and what is “high risk”, and for whom? From a technical viewpoint, variations in the frequency and recency of datasets, as well as their geographical reach, spatial granularity and boundaries, also present significant challenges for taking an integrated approach and for establishing comparability across cities.
The aim of this blog series:
Based on ongoing research at UBDC, this blog series on ‘Sustainability Data’ presents research results, debates and emerging insights which, we hope, stimulate further discussion and add value to researchers, policy makers, city managers, and government officials in general, who deal with these questions on a daily level. This first blog starts at the macro-level, presenting a pilot analysis of three UK cities and a UK nation’s approaches to localised SDG reporting'. This will be followed with insights from UK and global VLR stakeholder interviews to provide more detail regarding the technological and institutional factors which determine these methodological choices.
With ongoing research on digital local currency transactions to understand municipal cash transfer programmes’ contributions to the SDGs, the blog will also present insights into emerging sources of data to inform progress to the SDGs. We also invite readers to feed back with their experiences and views of local data for urban sustainability policymaking.
What data do cities and other subnational areas use for monitoring the Sustainable Development Goals?

(Both images above by P. Ulbrich)
Every year UN member states and wider civil society representatives meet at the United Nations High-Level Political Forum to report on their progress to the 17 Sustainable Development Goals (SDGs) in the form of Voluntary National Reviews (VNRs). In most cases, the responsibility of providing the data for the VNRs lies with the national statistics offices. The methodologies and datasets for national-level SDG reporting, therefore, tend to be informed by census and other conventional tools of official statistics, such as household surveys or Demographic and Health Surveys (DHS). These standardised methods are key for ensuring comparability across countries.
However, with over 56% of humanity living in urban areas (UN Population Division, 2023), “the struggle for global sustainability will be won or lost in cities”, as then-UN Secretary General Ban Ki-Moon already stated in 2012 (Ban, 2012). Recognising the importance of the subnational level for achieving the 2030 Agenda, an increasing number of cities and subnational entities are reporting on their progress to the SDGs in the form of Voluntary Local or Subnational Reviews (VLRs). Thus, the data revolution enables cities and subnational entities to draw on novel data sources, which, in theory, supports the localisation of SDG reporting. Combined with the proximity to the local level, the increased availability of a range of granular data promises a significant improvement in the ability to represent the issues concerning ‘those furthest behind’.
The ability of cities to draw on these new data sources raises the question, if and to which extent cities have taken this methodological opportunity for local sustainability reporting. We analysed the VLRs produced by four UK cities which engaged in this process and are listed on the UN-Habitat VLR page, which are Bristol (2022), Canterbury (2019), Liverpool (2020) (titled ‘Sustainable Development Goals Report’), and Scotland (2020) as pilot sample to answer this question. London’s SDG Indicator Dataset (2021) is yet to be analysed, while the Wales VLR (2019) only provides an indicator dashboard which draws on a separate report (the Well-being of Wales Report). Where available we consulted the corresponding SDG data platforms (e.g. in the case of Liverpool).
The four UK Voluntary Local / Subnational Reviews
We adopted a sequential approach in this pilot analysis. In a first step, we compared the number of indicators reported locally to the number of indicators in the global SDG framework. [Each of 17 SDGs comprises a number of targets which are measured with one or more indicator. There are 17 SDGs with 169 targets and 231 unique indicators.] This resulted in insights regarding the completeness of local reporting. In a second step, the analysis reports on the type of data sets selected for the indicators reported in the localised frameworks, followed by the type and the scale of the data source. The results of this analysis clearly illustrate the variation in approaches to localised SDG monitoring.
Results 1: The approach to SDG reporting: overall number of indicators with data
Figure 1 further below shows the level of completeness in reporting of indicators in each SDG target. With the squares representing the targets within each SDG, the range of colours indicates the level of completeness, as follows:

This first, macro-level analysis of UK VLRs suggests that Bristol’s 2022 VLR (Fig. 1, top left) appears to report on all SDGs with data on at least one target, except Goal 17 with a comparatively high proportion of targets that contain additional local indicators (purple squares), while other locally reported targets are unreported, as the grey squares suggest. Canterbury’s 2019 VLR reported primarily on SDGs 3 and 13, with most SDG targets unreported. Liverpool’s VLR, in turn, reported against several SDGs with the full set of indicators in a comparatively high proportion of targets (green squares, but unlike the other VLRs did not include extra indicators. Like Bristol (2022) Scotland’s VLR reported on most SDGs with against at least one target, and an additional number of indicators in six targets. With SDG 17 (‘partnerships for the goals’) being understood to be aimed at national level policies, it is the least reported Goal in the VLRs analysed here. Only Liverpool’s SDG data platform included it with data for 17.6 and 17.8 with UK level and city level data respectively. The tension between nationally defined indicator sets and local level reporting needs is clearly a key (and indeed much discussed) challenge.
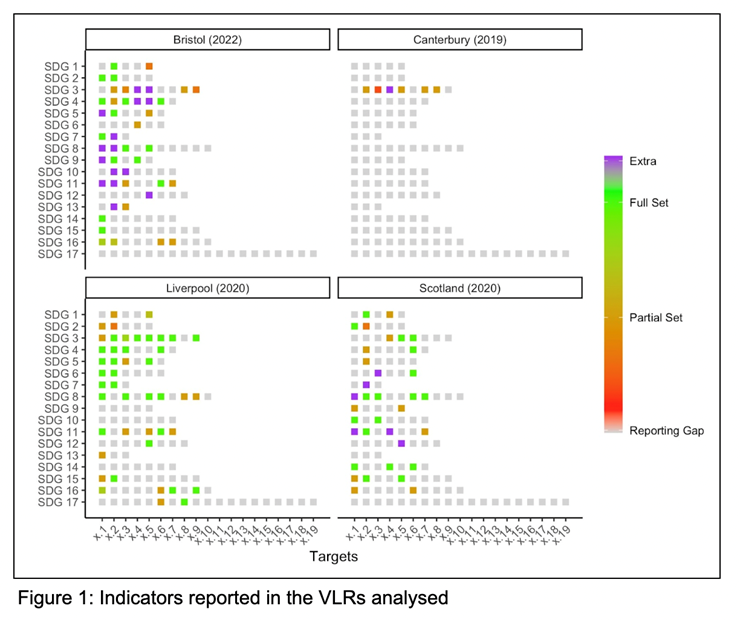
Looking at the VLRs individually, Bristol’s 2022 VLR appears to face a challenge with reporting for targets, particularly in SDGs 6, 12, 14, 15, and 16 (not counting Goal 17), and reports most indicators for SDGs 3, 4, and 11. That VLR also contains the highest number of Goals with additional indicators (10 Goals).
As a collection of ‘initial reports on local implementation of the Goals’ Canterbury’s VLR is the most qualitative progress report, with examples of policies relating to eigh Goals and one SDG (Goal 3) with indicators with data. Liverpool’s VLR appears to have relatively sufficient availability of datasets for reporting on the targets in Goals 3, 4, and 7, with some apparent challenges with reporting SDGs 9, 10, 12, 14, and 17.
Reporting on most SDGs with at least one target, Scotlands VLR is strongest in terms reporting on Goals 8 (‘decent work and economic growth’) and 11 (‘sustainable cities and communities’), with apparent data challenges regarding Goals 4, 5, 9, 13, and 16 (again, we are excluding Goal 17 from this narrative).
Results 2: Looking at the datasets used for SDG reporting
Regarding dataset source type, the VLRs analysed draw primarily on administrative records and surveys (see Fig. 2). [Only one indicator is informed by an alternative data source (15.1.1-Forest area in Bristol’s VLR, earth observation data on tree canopy cover).] Surveys in this analysis include the labour force survey administered by the Office for National Statistics and those conducted by the subnational entity or NGOs. Administrative records data refers to ministry-level datasets, such as the business register and public health-related profiles or traffic accident logs, as well as datasets from municipal agencies. Regarding the type of entity which provided the datasets (Fig. 3.), most of the data informing the reported indicators in the analysed VLRs is sourced from specific ministries / relevant municipal agencies, and the Office for National Statistics/city data or planning office. The use of non-traditional data sources, such as the private sector or civil society, is limited.
Regarding the scale of the data provider, Figure 4 shows an almost equal share between data from municipal agencies (blue) and the national level (green). The more detailed, target-level analysis in Figure 5 indicates that the VLRs analysed draw strongly on national level data for SDG 3, while data from city-level providers play a more important role for Goals 6 (‘clean water and sanitation’) and 11 - with data for the rest of Goals sourced from national and municipal data providers in varying proportions. The following paragraphs provide more detail for each VLR.

Of the four VLRs analysed, Bristol’s VLR (2022) shows the highest proportion of administrative record datasets (see Fig. 2), drawn from the Office for National Statistics and the municipal data office (see Fig. 3 below). Canterbury’s (2019) VLR exclusively reports with administrative data (Fig. 2) (for SDG 3, with the Local Health Profile) from the municipal level (Figures 3 and 4).
The Liverpool (2020) VLR shows a comparatively higher proportion of survey and administrative datasets to inform its indicators (Fig.2). Figure 3 shows that about a third of the indicators in this VLR draw their data from the ONS, and less than half of the reported indicators are informed by data from national ministry of municipal department sources. Regarding scale (Fig. 4), the Liverpool VLR is the only one which draws on datasets from global and multilateral providers, such as SDG target 6.1. (proportion of population using safely managed drinking water services), which was sourced from WHO and refers to country (UK) level data.

The insight that the Scotland VLR draws heavily on data from the relevant (sub national / although ‘national’ in the case of Scotland) (Figure 4) sectoral agencies (Fig. 3) is likely due to the nature of devolvement in the UK. While about half of its indicators are informed by data from specific ministries at national level or municipal agencies, civil society/NGO or research/university-provided data also plays an important role in Scotland’s VLR, with most of the data generated by administrative records, and the rest sourced from survey datasets (Fig. 2).

Taking Figure 4 which provide a target level analysis, we observe that data for Goal 3 (‘Good Health and Well-being’) is primarily sourced from national-level datasets, while local level datasets are included (though used to a varying extent) to measure progress in Goals 4, 5, 6, 9, 11, 13, 15, and 16.
Key insights - or, how to start making sense of it, and next steps
This pilot analysis of four UK VLRs shows that within a single country (the UK in this case), cities have taken very different methodological approaches in reporting their progress to a global sustainability framework. This suggests that the 2030 Agenda’s objective of maximising buy-in into the global framework by allowing for local-level adaptation and policy relevance may be achieved in these cases. However, the potential of localisation has not been achieved equally. Major challenges still appear to exist. These challenges relate to the following insights and questions:
- The reporting gaps and additional indicators: the analysis showed a variation in the SDGs that were reported. As the SDGs address issues which concern a range of urban policy areas from health to inequalities, economy and disaster risk, what drives the selection of localised SDG indicators?
- The limited use of ‘emerging’/’alternative’ data: the analysis also showed that almost half of the indicators were informed by data sourced form national-level providers, such as ministries or the Office for National Statistics. Considering the high level of political devolution in the UK, the potential for higher local-level methodological flexibility, what are the institutional, methodological and technological challenges to use of ground-level data from urban operations?
- The comparatively limited number of VLRs in the UK: To date only four cities (including London) and one UK nation (Scotland) have published their VLR. The number of cities which produced their VLRs in other countries with comparatively lower financial and institutional resources at the municipal level is proportionally higher (e.g. Brazil - 8 VLRs, Kenya - 4 VLRs, Indonesia - 2 VLRs). The same applies to economically comparable countries in Europe. What are the institutional and governance factors driving cities and subnational entities to localise the SDG indicator framework and prepare their VLRs?
Based on ongoing research at the UBDC, blog 2 in this VLR blog series will provide insights from the analysis of the rest of the global VLRs. With initial insights from workshops and interviews in the UK and cities globally, Blog 3 will address the questions raised above and others, such as the scalar tensions in this multi-level governance framework, which emerged during the analyses.
Blog entry PU / DP / MC / JPA 09/23
Jointly funded by


